How to build your first data pipeline
Create a simple data pipeline in a few clicks
Data Pipelines allows people of all skill levels to build pipelines quickly and easily.
To keep things simple, in this tutorial we will create a pipeline using inline data (sample data you enter in the browser). The process is exactly the same as using a real data source, for example an SQL table or CSV files. Inline data can be combined with 'real' external data, useful for debugging while developing pipelines. You can read more about how to connect your data here.
Before you create your first pipeline, you may want to create a Project but it's optional. You can use projects to group pipelines into logical collections.
There are multiple ways to create pipelines (for example by importing a JSON definition), but in this tutorial we will focus on the Pipeline Builder.
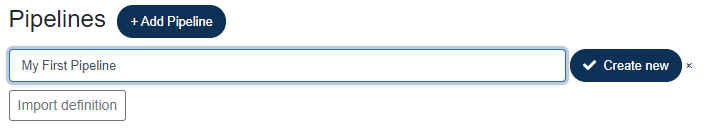
Click Add Pipeline, enter a name for your pipeline then click Create new.
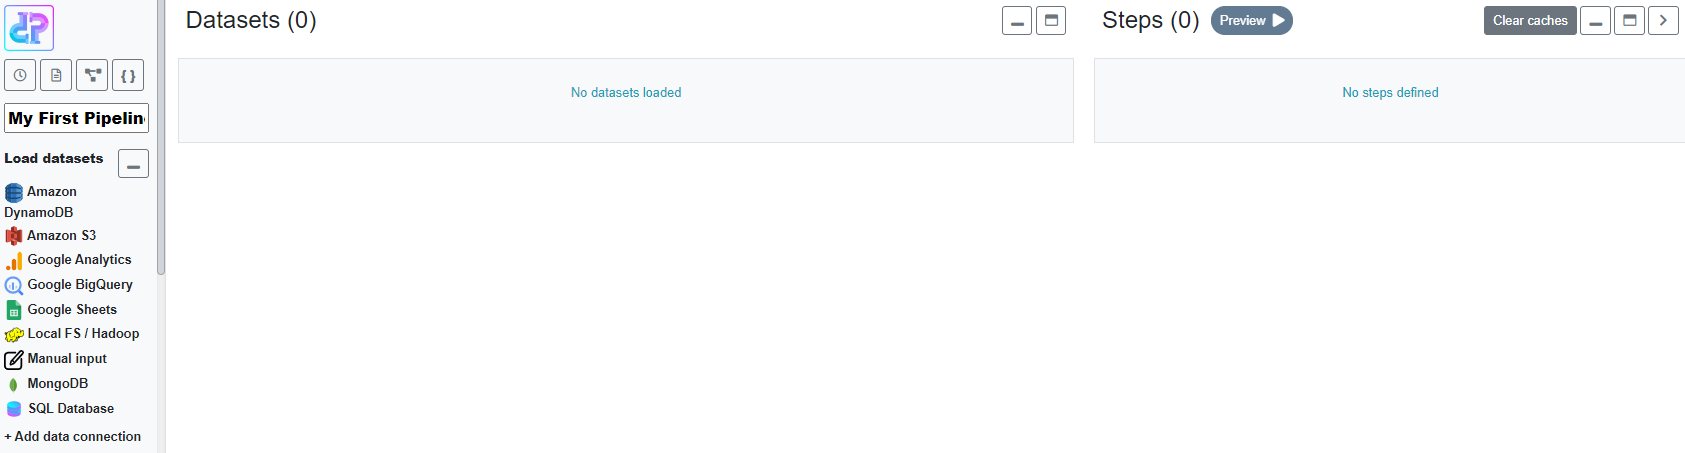
A new pipeline will be created and opened in the Pipeline Builder view. Depending on what data connections you have defined, you may not see some of the connection types under Load datasets.
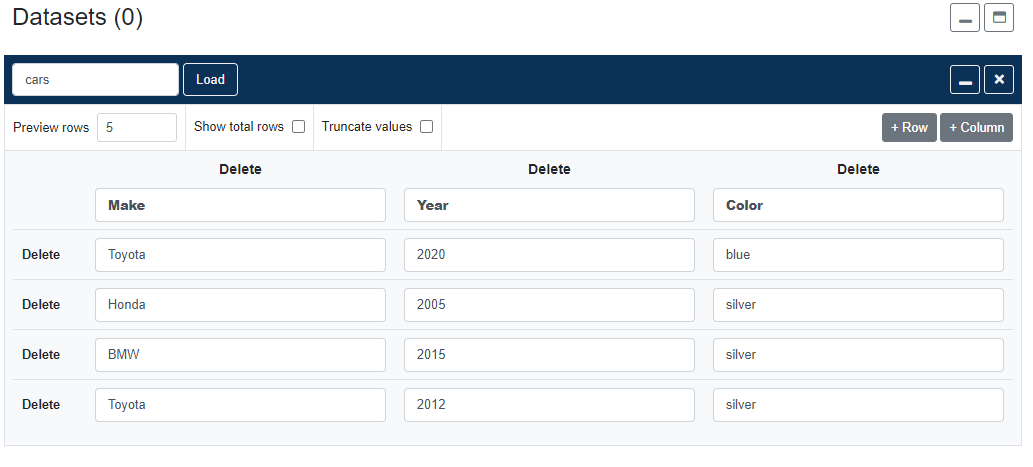
Click Manual input, add some sample data and click Load. Every time a dataset is added, regardless of the connection type, it needs to be registered in your pipeline by clicking Load.
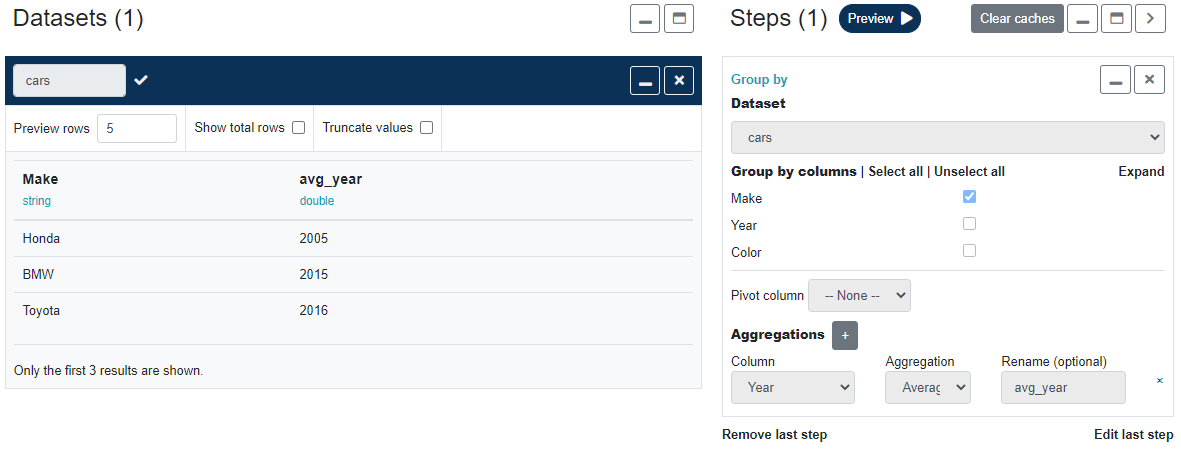
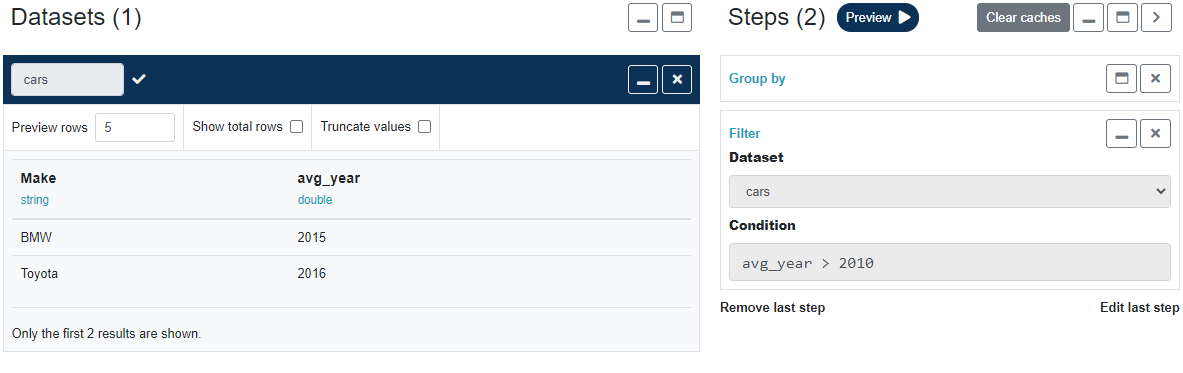
Once you have some data in your pipeline, you can use the widgets in the control panel on the left to add transformation steps. There is no limit on the number of steps per pipeline. Each time you add a step, click Preview to apply the transformation and refresh the pipeline output preview.
Add another step to filter cars that were made after 2010.
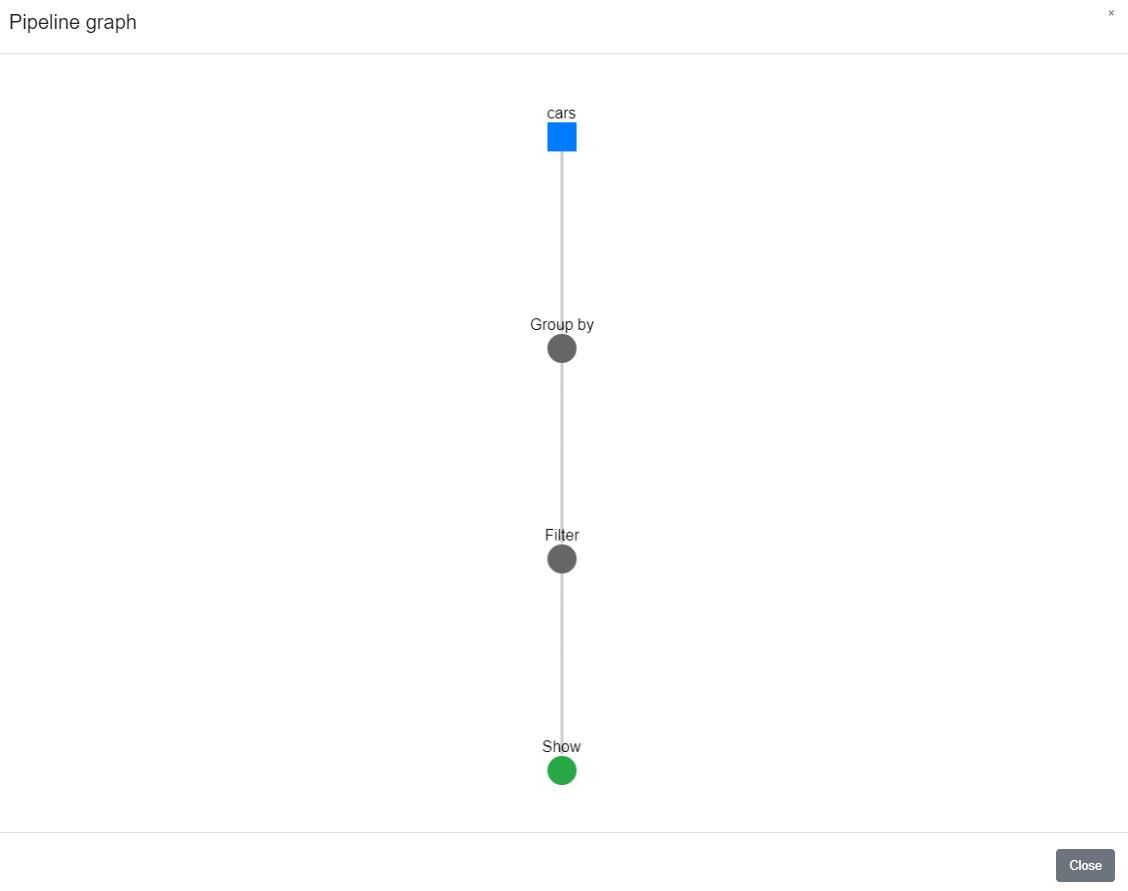
Your pipeline may comprise many datasets and hundreds of transformation steps and can be difficult to understand at a glance. You may find the Pipeline DAG (directed acyclic graph) view useful to quickly visualize the relationships and transformation steps in your pipeline.
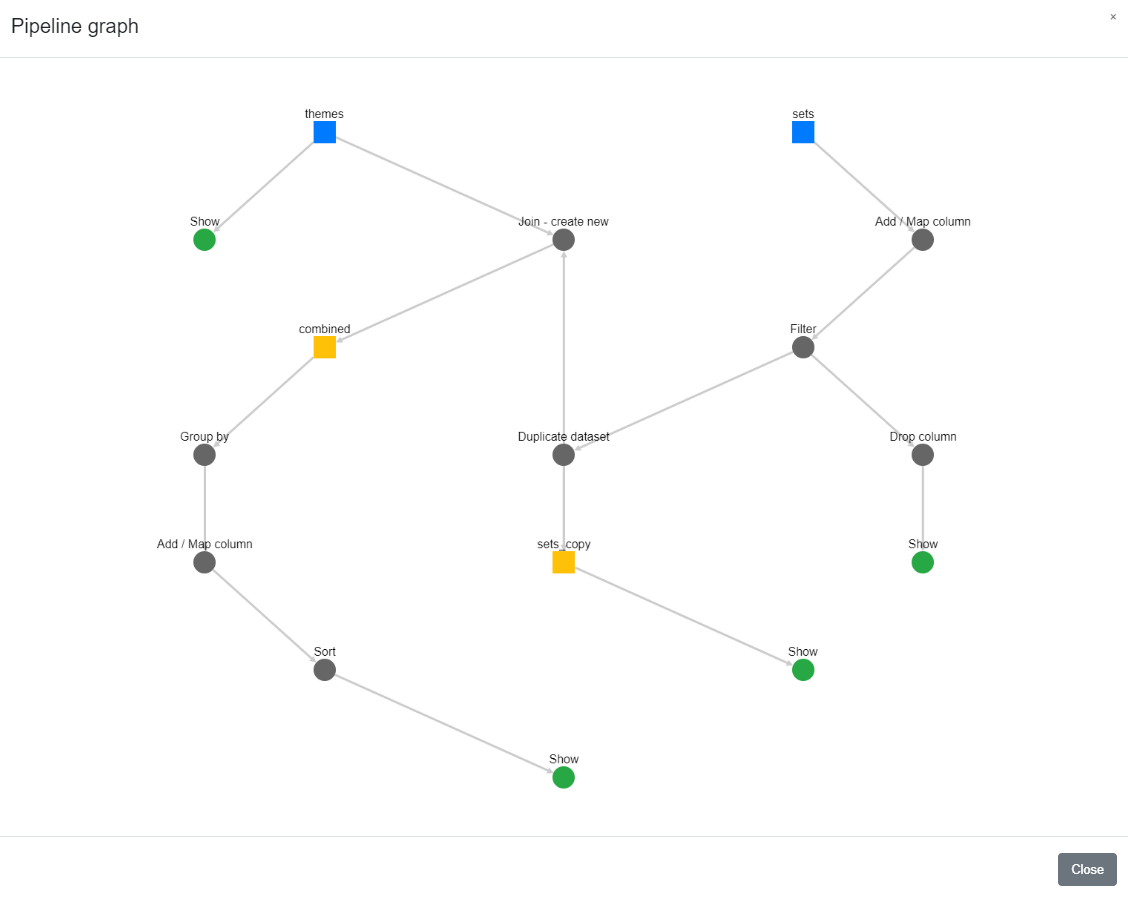
Pipelines and their corresponding graphs may get complex.
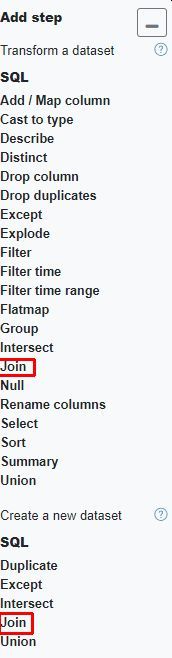
Some transformations can be used to create a new dataset. For example, as shown in the below screenshot, the Join operation can be applied in two ways. One will overwrite the left dataset with the results of the join operation, the other will create a new dataset which can then be used just like any other dataset. It can be combined with other datasets and be applied transformations.
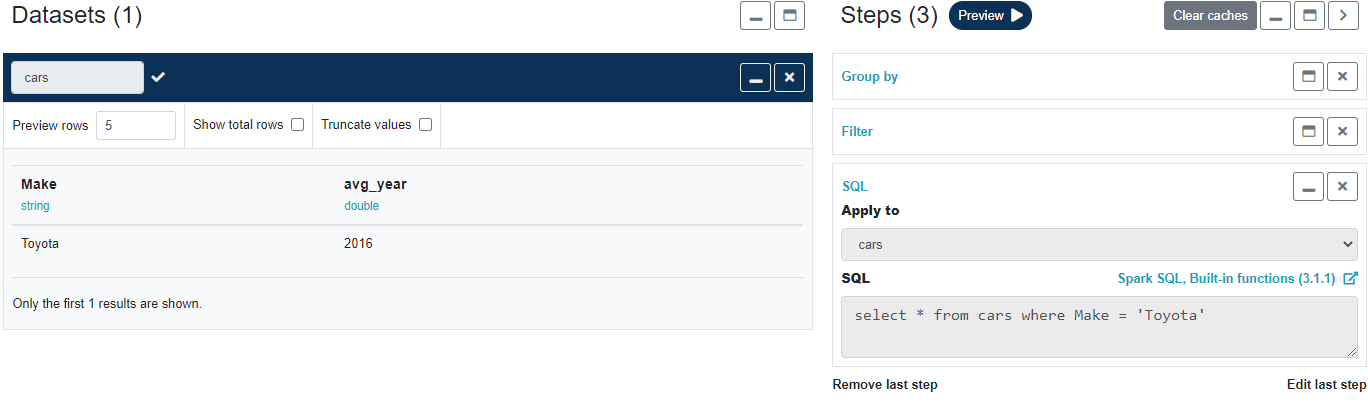
If you are familiar writing Spark SQL you may add a SQL step where you can enter custom Spark SQL manually. You may use any Apache Spark function from the official Spark documentation.
Any dataset displayed in the builder can be written to a data connection of your choice via either a schedule or the Quick Write widget.
The Quick Write widget is intended for debugging purposes only. It is very basic and does not have the write options (eg. whether to GZip the output) that the scheduler does. It uses some sensible defaults.