Error handling
How to interpret data pipeline error messages and debug your pipeline
Data pipelines can fail for many reasons, ranging from various user errors to missing permissions.
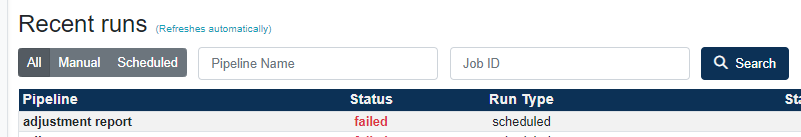
Whenever a pipeline fails the system will show a detailed error message in the pipeline builder view. This error message can later be retrieved on the dashboard by clicking the 'failed' job status in the Recent Runs section.
Error messages are just stack traces (what is a stack trace?). The first line usually tells you the exact reason the pipeline has failed.
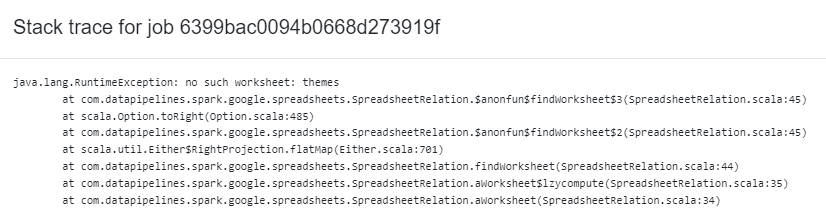
In the above example, the first line contains "no such worksheet: themes". What this means is that the pipeline tried to access a worksheet named "themes" in a Google Sheet and couldn't find it. From this we can infer that the connection to the Google Sheet itself worked fine and the spreadsheet was found.
While trying to debug, step one should always be reading the error message. It usually tells you the exact reason for the error.
Some common reasons why pipelines fail are:
- permission issues, for example: AWS user doesn't have write access to a bucket.
- incorrect credentials
- incorrect connection URL (for JDBC / database connections)
- Data Pipelines IP address not whitelisted on firewall (when accessing databases)
- referencing a column that doesn't exist in the dataset
- syntax error when writing Spark SQL
- monthly processing limit reached (Adopter accounts only)
To get help with an error you can drop support a message.